Landscape Survey: Turning Dumpy Level Measurements into a Profile Diagram
This visual representation will help you understand the lay of the land. You then have the opportunity to reflect on what this tells you about the terrain and activity on site.
Activity: Turning Dumpy Level Measurements into a Profile Diagram
Duration: 60 minutes
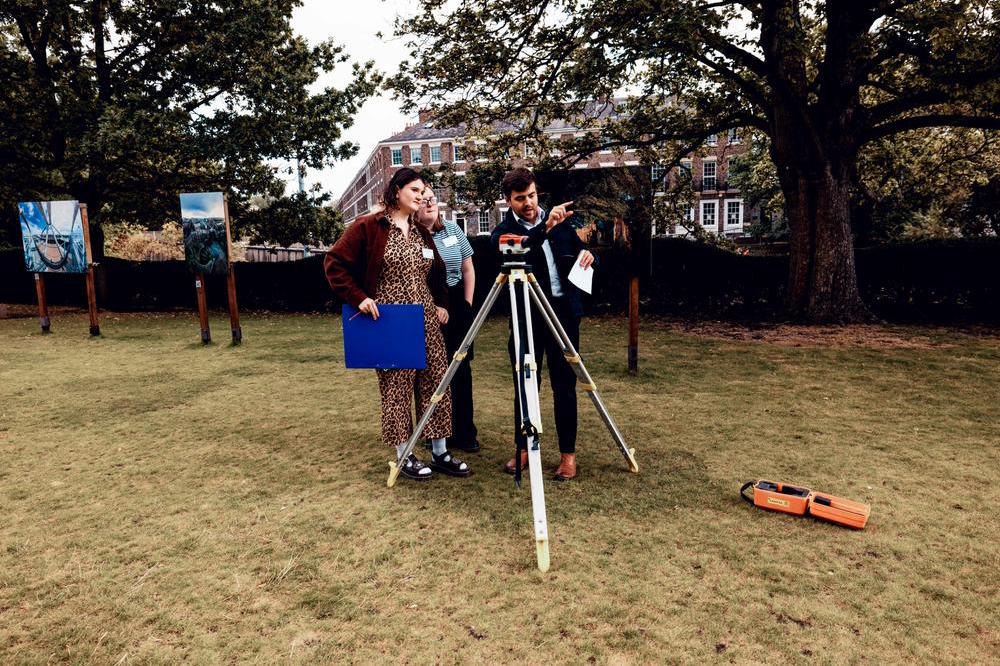
Location: Indoors or outdoors with completed dumpy level measurements
Learning Aims
By completing this activity, you will:
- Understand how dumpy level measurements relate to height differences
- Learn how to transfer recorded data onto paper
- Create a simple profile diagram showing changes in ground level
- Develop skills in accuracy, organisation, and interpretation
Equipment
- Completed level record sheet (with reduced levels or readings) (example sheets have been provided at the end)
- Graph paper
- Pencil and ruler
- Eraser
- Calculator (optional)
Activity Steps
1. Start by checking your level record sheet (10 minutes):
- Identify each survey point in the order it was measured
- Check that reduced levels (heights) have been calculated, or calculate them now
- Look for patterns: where does the ground rise or fall?
Remember: Your diagram will visually represent these changes in height.
2: Set Up the Graph Paper (10 minutes)
- Use the horizontal axis (X‑axis) to represent distance along the survey line
- Use the vertical axis (Y‑axis) to represent height
- Choose a suitable scale, for example:
- 1 cm = 1 metre distance
- 1 cm = 0.2 metres height
- Label both axes clearly, including the units used
3: Plot the Measurements (20 minutes)
- Start with your first survey point
- Measure along the X‑axis to the correct distance
- Measure up the Y‑axis to the correct height
- Mark the point clearly with a small dot
- Repeat this for every recorded point in order
Take your time—accuracy matters more than speed.
4: Create the Diagram (10 minutes)
- Use a ruler to join the plotted points with a clean line
- This line creates a profile diagram showing how the land rises and falls
- Compare your diagram to the real landscape:
- Where are the slopes steep?
- Where is the ground flatter?
5: Add Labels and Interpretation (10 minutes)
- Add a title (e.g. Ground Profile from Survey Line A–B)
- Label key features such as slopes, hollows, or platforms
- Write a short note describing what the diagram shows
What You’ve Achieved
You have:
- Translated numerical survey data into a visual diagram
- Practised technical drawing and data interpretation
- Developed skills used in archaeology, surveying, construction, and engineering
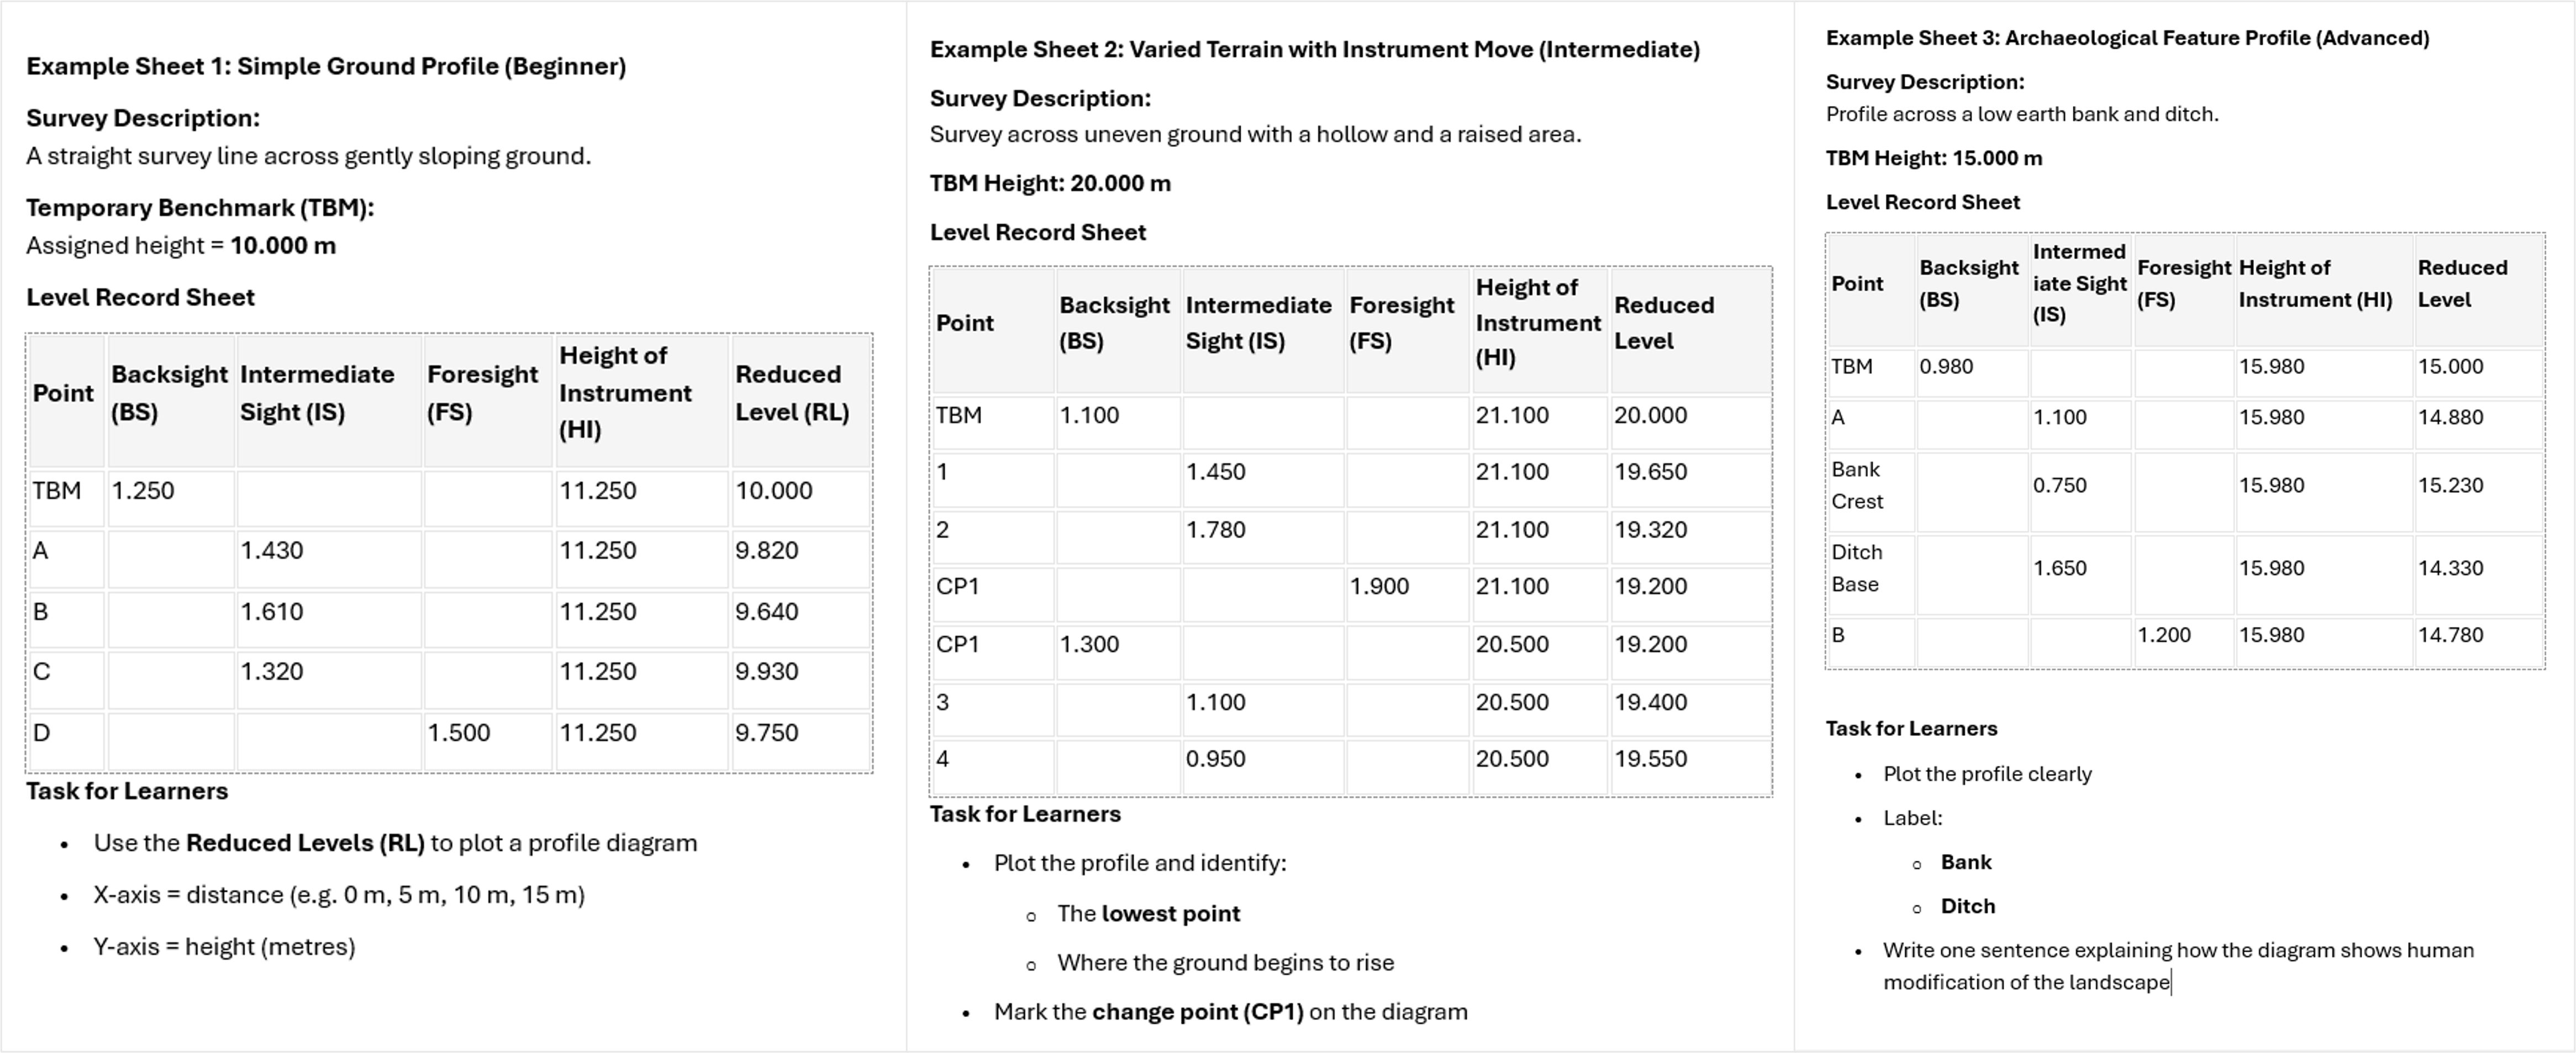
Level Sheet Examples